Showing posts with label metrics. Show all posts

Sunday, July 15, 2012

Site Enrollment Performance: A Better View

Pretty much everyone involved in patient recruitment for clinical trials seems to agree that "metrics" are, in some general sense, really really important. The state of the industry, however, is a bit dismal, with very little evidence of effort to communicate data clearly and effectively. Today I’ll focus on the Site Enrollment histogram, a tried-but-not-very-true standby in every trial.

Consider this graphic, showing enrolled patients at each site. It came through on a weekly "Site Newsletter" for a trial I was working on:


I chose this histogram not because it’s particularly bad, but because it’s supremely typical. Don’t get me wrong ... it’s really bad, but the important thing here is that it looks pretty much exactly like every site enrollment histogram in every study I’ve ever worked on.

This is a wasted opportunity. Whether we look at per-site enrollment with internal teams to develop enrollment support plans, or share this data with our sites to inform and motivate them, a good chart is one of the best tools we have. To illustrate this, let’s look at a few examples of better ways to look at the data.

If you really must do a static site histogram, make it as clear and meaningful as possible. 

This chart improves on the standard histogram in a few important ways:


Stateful histo - click to enlarge

  1.  It looks better. This is not a minor point when part of our work is to engage sites and makes them feel like they are part of something important. Actually, this graph is made clearer and more appealing mostly by the removal of useless attributes (extraneous whitespace, background colors, and unhelpful labels).
  2. It adds patient disposition information. Many graphs – like the one at the beginning of this post – are vague about who is being counted. Does "enrolled" include patients currently being screened, or just those randomized? Interpretations will vary from reader to reader. Instead, this chart makes patient status an explicit variable, without adding to the complexity of the presentation. It also provides a bit of information about recent performance, by showing patients who have been consented but not yet fully screened.
  3. It ranks sites by their total contribution to the study, not by the letters in the investigator’s name. And that is one of the main reasons we like to share this information with our sites in the first place.
Find Opportunities for Alternate Visualizations
 
There are many other ways in which essentially the same data can be re-sliced or restructured to underscore particular trends or messages. Here are two that I look at frequently, and often find worth sharing.

Then versus Now

Tornado chart - click to enlarge

This tornado chart is an excellent way of showing site-level enrollment trajectory, with each sites prior (left) and subsequent (right) contributions separated out. This example spotlights activity over the past month, but for slower trials a larger timescale may be more appropriate. Also, how the data is sorted can be critical in the communication: this could have been ranked by total enrollment, but instead sorts first on most-recent screening, clearly showing who’s picked up, who’s dropped off, and who’s remained constant (both good and bad).

This is especially useful when looking at a major event (e.g., pre/post protocol amendment), or where enrollment is expected to have natural fluctuations (e.g., in seasonal conditions).

Net Patient Contribution

In many trials, site activation occurs in a more or less "rolling" fashion, with many sites not starting until later in the enrollment period. This makes simple enrollment histograms downright misleading, as they fail to differentiate sites by the length of time they’ve actually been able to enroll. Reporting enrollment rates (patients per site per month) is one straightforward way of compensating for this, but it has the unfortunate effect of showing extreme (and, most importantly, non-predictive), variance for sites that have not been enrolling for very long.

As a result, I prefer to measure each site in terms of its net contribution to enrollment, compared to what it was expected to do over the time it was open:
Net pt contribution - click to enlarge

To clarify this, consider an example: A study expects sites to screen 1 patient per month. Both Site A and Site B have failed to screen a single patient so far, but Site A has been active for 6 months, whereas Site B has only been active 1 month.

On an enrollment histogram, both sites would show up as tied at 0. However, Site A’s 0 is a lot more problematic – and predictive of future performance – than Site B’s 0. If I compare them to benchmark, then I show how many total screenings each site is below the study’s expectation: Site A is at -6, and Site B is only -1, a much clearer representation of current performance.

This graphic has the added advantage of showing how the study as a whole is doing. Comparing the total volume of positive to negative bars gives the viewer an immediate visceral sense of whether the study is above or below expectations.

The above are just 3 examples – there is a lot more that can be done with this data. What is most important is that we first stop and think about what we’re trying to communicate, and then design clear, informative, and attractive graphics to help us do that.

Wednesday, June 20, 2012

Faster Trials are Better Trials

[Note: this post is an excerpt from a longer presentation I made at the DIA Clinical Data Quality Summit, April 24, 2012, entitled Delight the Sites: The Effect of Site/Sponsor Relationships on Site Performance.]

When considering clinical data collected from sites, what is the relationship between these two factors?
  • Quantity: the number of patients enrolled by the site
  • Quality: the rate of data issues per enrolled patient
When I pose this question to study managers and CRAs, I usually hear that they believe there is an inverse relationship at work. Specifically, most will tell me that high-enrolling sites run a great risk of getting "sloppy" with their data, and that they will sometimes need to caution sites to slow down in order to better focus on accurate data collection and reporting.

Obviously, this has serious implications for those of us in the business of accelerating clinical trials. If getting studies done faster comes at the expense of clinical data quality, then the value of the entire enterprise is called into question. As regulatory authorities take an increasingly skeptical attitude towards missing, inconsistent, and inaccurate data, we must strive to make data collection better, and absolutely cannot afford to risk making it worse.

As a result, we've started to look closely at a variety of data quality metrics to understand how they relate to the pace of patient recruitment. The results, while still preliminary, are encouraging.

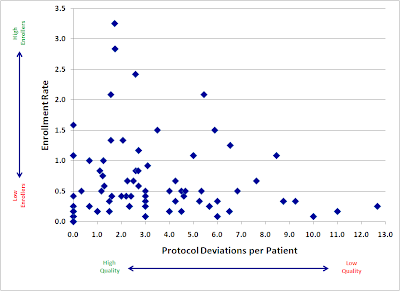
Here is a plot of a large, recently-completed trial. Each point represents an individual research site, mapped by both speed (enrollment rate) and quality (protocol deviations). If faster enrolling caused data quality problems, we would expect to see a cluster of sites in the upper right quadrant (lots of patients, lots of deviations).

Click to enlarge: Enrollment and Quality


Instead, we see almost the opposite. Our sites with the fastest accrual produced, in general, higher quality data. Slow sites had a large variance, with not much relation to quality: some did well, but some of the worst offenders were among the slowest enrollers.

There are probably a number of reasons for this trend. I believe the two major factors at work here are:
  1. Focus. Having more patients in a particular study gives sites a powerful incentive to focus more time and effort into the conduct of that study.
  2. Practice. We get better at most things through practice and repetition. Enrolling more patients may help our site staff develop a much greater mastery of the study protocol.
The bottom line is very promising: accelerating your trial’s enrollment may have the added benefit of improving the overall quality of your data.

We will continue to explore the relationship between enrollment and various quality metrics, and I hope to be able to share more soon.

Tuesday, June 19, 2012

Pfizer Shocker: Patient Recruitment is Hard

In what appears to be, oddly enough, an exclusive announcement to Pharmalot, Pfizer will be discontinuing its much-discussed “Trial in a box”—a clinical study run entirely from a patient’s home. Study drug and other supplies would be shipped directly to each patient, with consent, communication, and data collection happening entirely via the internet.

The trial piloted a number of innovations, including some novel and intriguing Patient Reported Outcome (PRO) tools.  Unfortunately, most of these will likely not have been given the benefit of a full test, as the trial was killed due to low patient enrollment.

The fact that a trial designed to enroll less than 300 patients couldn’t meet its enrollment goal is sobering enough, but in this case the pain is even greater due to the fact that the study was not limited to site databases and/or catchment areas.  In theory, anyone with overactive bladder in the entire United States was a potential participant. 

And yet, it didn’t work.  In a previous interview with Pharmalot, Pfizer’s Craig Lipset mentions a number of recruitment channels – he specifically cites Facebook, Google, Patients Like Me, and Inspire, along with other unspecified “online outreach” – that drove “thousands” of impressions and “many” registrations, but these did not amount to, apparently, even close to the required number of consented patients. 

Two major questions come to mind:

1.    How were patients “converted” into the study?  One of the more challenging aspects of patient recruitment is often getting research sites engaged in the process.  Many – perhaps most – patients are understandably on the fence about being in a trial, and the investigator and study coordinator play the single most critical role in helping each patient make their decision. You cannot simply replace their skill and experience with a website (or “multi-media informed consent module”). 

2.    Did they understand the patient funnel?  I am puzzled by the mention of “thousands of hits” to the website.  That may seem like a lot, if you’re not used to engaging patients online, but it’s actually not necessarily so. 
Jakob Nielsen's famous "Lurker Funnel"
seems worth mentioning here...
Despite some of the claims made by patient communities, it is perfectly reasonable to expect that less than 1% of visitors (even somewhat pre-qualified visitors) will end up consenting into the study.  If you’re going to rely on the internet as your sole means of recruitment, you should plan on needing closer to 100,000 visitors (and, critically: negotiate your spending accordingly). 

In the prior interview, Lipset says:
I think some of the staunch advocates for using online and social media for recruitment are still reticent to claim silver bullet status and not use conventional channels in parallel. Even the most aggressive and bullish social media advocates, generally, still acknowledge you’re going to do this in addition to, and not instead of more conventional channels.

This makes Pfizer’s exclusive reliance on these channels all the more puzzling.  If no one is advocating disintermediating the sites and using only social media, then why was this the strategy?

I am confident that someone will try again with this type of trial in the near future.  Hopefully, the Pfizer experience will spur them to invest in building a more rigorous recruitment strategy before they start.

[Update 6/20: Lipset weighed in via the comments section of the Pharmalot article above to clarify that other DTP aspects of the trial were tested and "worked VERY well".  I am not sure how to evaluate that clarification, given the fact that those aspects couldn't have been tested on a very large number of patients, but it is encouraging to hear that more positive experiences may have come out of the study.]

Monday, April 11, 2011

Accelerated Approvals are Too Fast, Except When They're Too Slow

A great article in Medscape reports on two unrelated articles on the FDA’s process for granting (and following up on) Accelerated Approvals of oncology drugs.

First, a very solid review of all oncology drugs approved through the accelerated process since 1992 is in the latest journal of the National Cancer Institute. The review, written by FDA personnel, is in general concerned with the slow pace of confirmatory Phase 3 trials – over a third (18 of 47) have not yet been completed, and even the ones that have completed have taken considerable time. The authors consider process changes and fines as viable means for the FDA to encourage timely completion.

Second, over at the New England Journal of Medicine, Dr Bruce Chabner has a perspective piece that looks at the flip side: he argues that some compounds should be considered even earlier for accelerated approval, using the example of Plexxikon’s much-heralded PLX4032, which showed an amazing 80% response rate in Metastatic Melanoma (albeit in a very small sample of 38 patients).

I would argue that we are just now starting to get enough experience to have a very good conversation about accelerated approval and how to improve it -- still, less than 50 data points (47 approved indications) means that we need to remind ourselves that we're still mostly in the land of anecdote. However, it may be time to ask: how much does delay truly cost us in terms of our overall health? What is the cost of delayed approval (how many patients may potentially suffer from lack of access), and correspondingly what is the cost of premature approval and/or delayed confirmation (how many patients are exposed to ineffective and toxic treatments)?

The good news, to me, is that we're finally starting to collect enough information to make a rational estimate of these questions.

Friday, March 25, 2011

Mind the Gap

Modern clinical trials in the pharmaceutical industry are monuments of rigorous analysis. Trial designs are critically examined and debated extensively during the planning phase – we strain to locate possible sources of bias in advance, and adjust to minimize or compensate for them. We collect enormous quantities of efficacy and safety data using standardized, pre-validated techniques. Finally, a team of statisticians parses the data (adhering, of course, to an already-set-in-stone Statistical Analysis Plan to avoid the perils of post-hoc analysis) … then we turn both the data and the analysis over in their entirety to regulatory authorities, who in turn do all they can to verify that the results are accurate, correctly interpreted, and clinically relevant.

It is ironic, then, that our management of these trials is so casual and driven by personal opinions. We all like to talk a good game about metrics, but after the conversation we lapse back into our old, distinctly un-rigorous, habits. Example of this are everywhere once you start to look for them: one that just caught my eye is from a recent Center Watch article:

Survey: Large sites winning more trials than small

Are large sites—hospitals, academic medical centers—getting all the trials, while smaller sites continue to fight for the work that’s left over?

That’s what results of a recent survey by Clinical Research Site Training (CRST) seem to indicate. The nearly 20-year-old site-training firm surveyed 500 U.S. sites in December 2010, finding that 66% of large sites say they have won more trials in the last three years. Smaller sites weren’t asked specifically, but anecdotally many small and medium-sized sites reported fewer trials in recent years.
Let me repeat that last part again, with emphasis: “Smaller sites weren’t asked specifically, but anecdotally…

At this point, the conversation should stop. Nothing to see here, folks -- we don’t actually have evidence of anything, only a survey data point juxtaposed with someone’s personal impression -- move along.

So what are we to do then? I think there are two clear areas where we collectively need to improve:

1. Know what we don’t know. The sad and simple fact is that there are a lot of things we just don’t have good data on. We need to resist the urge to grasp at straws to fill those knowledge gaps – it leaves the false impression that we’ve learned something.

2. Learn from our own backyard. As I mentioned earlier, good analytic practices are pervasive on the executional side of trials. We need to think more rigorously about our data needs, earlier in the process.

The good news is that we have everything we need to make this a reality – we just need to have a bit of courage to admit the gap (or, occasionally, chasm) of our ignorance on a number of critical issues and develop a thoughtful plan forward.